EV Charging Efficiency Loss: Causes and What to Expect
EV charging efficiency loss typically costs 10–15% of the electricity you pay for on Level 2 home charging, and more on Level 1. The main check is your vehicle’s onboard-charger limit and your local electrical requirements, since those determine what you can actually use.
EV charging efficiency loss is the gap between the electricity your utility meter or charging network bills you for and the energy that actually reaches the battery. For most U.S. drivers charging at home on Level 2, that gap runs roughly 10–15%, so you pay for about 1.1–1.2 kWh for every 1 kWh stored.
- Compatibility: A higher-amp EVSE only helps if your vehicle’s onboard charger accepts that current.
- Performance: Published estimates put Level 2 wall-to-battery efficiency near 85–92% and Level 1 near 75–85%.
- Safety: Follow manufacturer instructions and local code for circuits, breakers, wire sizing, and permits.
- Cost: Divide needed battery kWh by charging efficiency, then multiply by your rate to get.
EV Charging Efficiency Loss: The Short Answer and What to Expect in 2026
The short answer: AC charging is never 100% efficient, but the loss is usually small enough that it changes your monthly bill by a few dollars, not a few hundred. DC fast charging skips the onboard charger but adds thermal overhead, so it is not automatically “loss-free” either.
Why 100% of Metered Electricity Does Not Reach the Battery
Every conversion step costs energy. AC from the grid must be rectified to DC, voltage must be stepped to match pack voltage, and the pack and its thermal system must be kept in a safe temperature window. Each step produces heat, and heat is electricity you paid for but never stored.
Typical AC and DC Efficiency Loss Ranges for U.S. Drivers
Published estimates commonly place Level 2 home charging at about 85–92% wall-to-battery efficiency, Level 1 at roughly 75–85%, and DC fast charging at roughly 90–95% at the pack before thermal-management overhead is counted. Treat these as general patterns, not specifications for your car.
Key Terms: Wall-to-Battery Efficiency, kWh Delivered, and Charging Overhead
Wall-to-battery efficiency is the percentage of metered energy that ends up stored. kWh delivered is what the meter counts. Charging overhead covers everything else: conversion heat, cable resistance, pumps, fans, and standby draw.
Where EV Charging Efficiency Loss Comes From: A Component-by-Component Breakdown
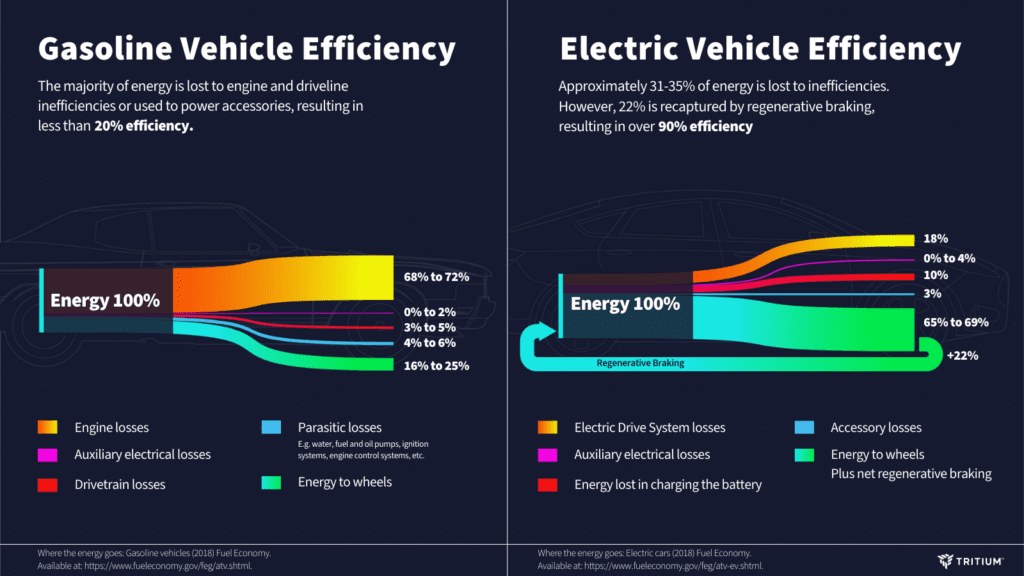
Losses stack. Understanding which parts of the chain contribute helps you decide whether a change is worth the money.
Onboard Charger Conversion Losses: AC to DC
The onboard charger is the biggest single source of AC loss. It converts 120 V or 240 V AC into DC at the pack’s voltage, and the conversion is typically 90–95% efficient on modern hardware, with older or lower-power units often on the lower end.
EVSE, Cable, and Connector Resistance
The wall unit, cable, and connector contribute a much smaller share, usually low single digits. Resistance rises with heat, long cable runs, worn connectors, or undersized conductors, which is one reason installation quality matters.
Battery Thermal Management, Charging Taper, and State of Charge
Pumps, fans, and heaters can run during a session, and DC fast charging often triggers active cooling. Above roughly 80% state of charge, most vehicles taper power, so a larger share of the session is spent on overhead rather than energy transfer.
Standby, Smart Features, and Preconditioning Overhead
Connected features, Wi-Fi modules, and scheduled-charging logic draw small amounts of power. Cabin or battery preconditioning while plugged in can consume far more than standby and will show up as delivered kWh that never becomes range.
AC Level 1 vs Level 2 vs DC Fast Charging: Efficiency and Trade-Offs Compared
The charging level changes both the size of the loss and how much it matters in daily use.
Level 1 Charging: Low Power, Long Sessions, Higher Relative Losses
A standard 120 V household outlet delivers roughly 1.4–1.9 kW. Because sessions run for many hours, fixed overhead and thermal management consume a larger share of the total, which is why Level 1 typically shows the worst wall-to-battery percentage.
Level 2 Charging: The Efficiency Sweet Spot for Most Homes
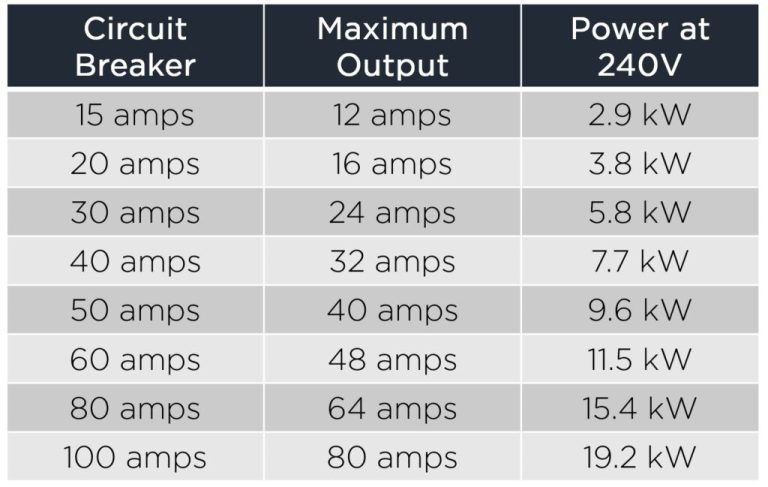
At 240 V, most EVs accept between about 3.8 kW and 11.5 kW. Higher power shortens sessions, so fixed overhead is spread over more energy and the percentage loss drops. That is why Level 2 is the practical default for most households, even if a 40-amp Level 2 setup is more than enough for overnight charging.
DC Fast Charging: Higher Power, Thermal Losses, and Tapering
DC fast charging bypasses the onboard charger, so conversion losses are lower. But high current generates heat, thermal systems work harder, and taper above roughly 80% means the final portion of a session is inefficient per kWh delivered.
Comparing Power, Losses, Cost, Battery Impact, and Best Use Case
| Charging type | Typical range (published estimates) | Why it matters |
|---|---|---|
| Level 1 (120 V AC) | ~1.4–1.9 kW; ~75–85% wall-to-battery | Cheapest install, highest relative loss, best for low-mileage drivers |
| Level 2 (240 V AC) | ~3.8–11.5 kW; ~85–92% wall-to-battery | Best efficiency-to-cost balance for home charging |
| DC fast charging | Varies widely; ~90–95% at pack, less with thermal overhead | Fastest option, higher cost per kWh, taper above ~80% SOC |
Charger and Installation Factors That Change Efficiency and Total Cost
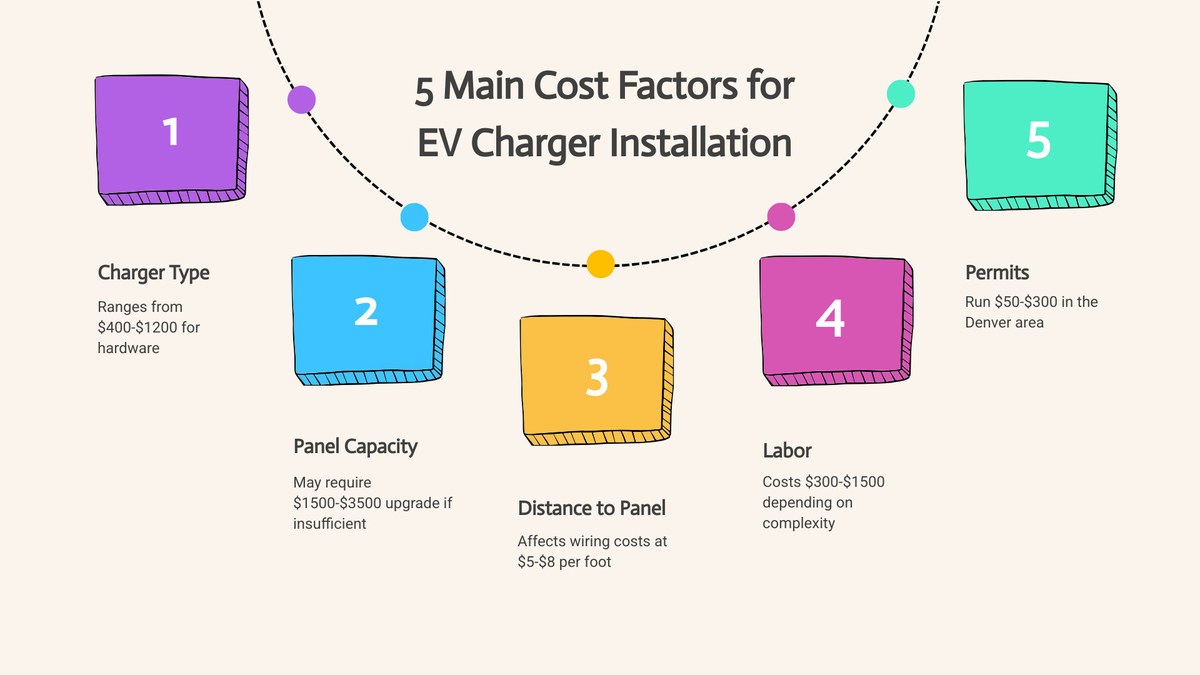
Equipment choices affect both the loss percentage and what you pay up front.
EVSE Amperage, kW Rating, and the Vehicle Onboard-Charger Limit
A higher-amperage EVSE only helps if the vehicle’s onboard charger can accept it. Buying a 48-amp unit for a car limited to 32 amps adds cost without adding speed. If you are comparing ratings, this explainer on how many kW a 48-amp Level 2 charger delivers covers the math.
Plug-In vs Hardwired EVSE: Power, Weather, and Code Implications
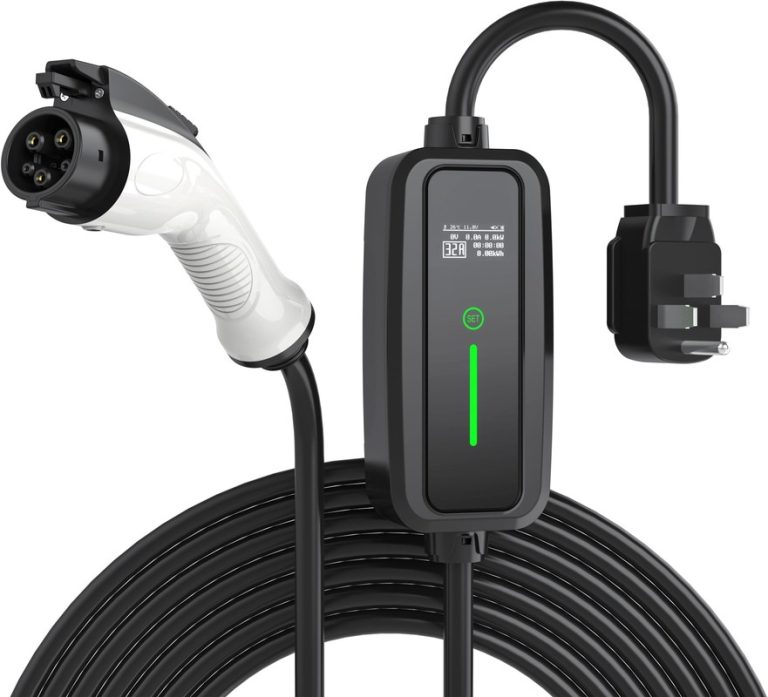
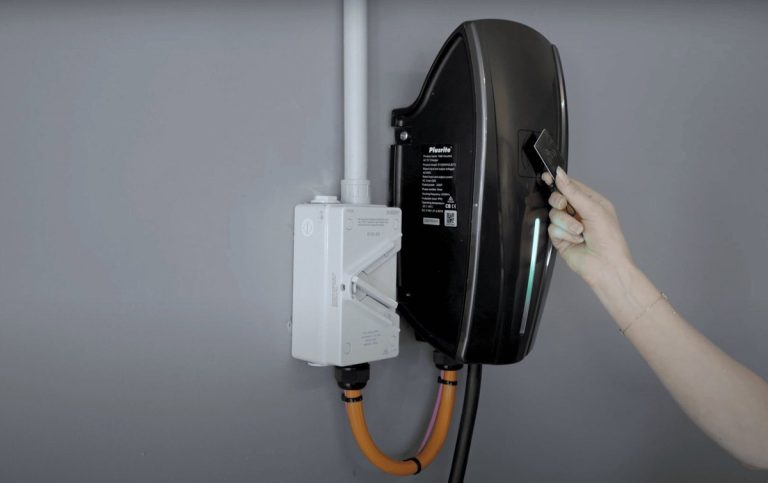
Hardwired units typically support higher continuous current and avoid receptacle wear; plug-in units are portable but usually cap out lower and depend on a correctly rated receptacle. Either way, the circuit must match the equipment instructions — this guide on whether a 48-amp charger needs a 60-amp circuit walks through the relationship.
Circuit, Panel, Breaker, and Permit Rules: Follow the Manual and Local Code
Undersized conductors increase resistance and heat, which wastes energy and creates real risk. Wire sizing, breaker selection, and grounding requirements come from the equipment instructions and your local code, not from a universal rule of thumb. Conductor sizing for high-current installs is covered in this 48-amp EV charger wire size reference.
Cable Length, Connector Type, Weather Suitability, and Support
Longer cables add slight resistance, and outdoor units need a verified enclosure rating plus a stated operating-temperature range. Check the connector type against your vehicle inlet, confirm the safety listing on the certification record, and review warranty terms and support before buying.
Adapters and Connectors: Source, Destination, Direction, and Safety Limits
Adapters change physical fit, not charging protocol. Direction matters more than most owners expect.
AC Adapter Scenarios: J1772, Tesla/NACS, and Destination Connectors
AC adapters such as J1772-to-NACS pass Level 1 or Level 2 AC only. They do not enable DC fast charging, and some are rated for lower current than the EVSE can supply.
DC Adapter Scenarios: CCS, NACS, CHAdeMO, and Why Direction Matters
DC adapters are vehicle-specific and direction-specific. A CCS1-to-NACS adapter and a NACS-to-CCS1 adapter are different products with different ratings, and CHAdeMO support is limited and shrinking.
Vehicle and Network Restrictions, Power Limits, and Firmware Requirements
Even a correct adapter may be blocked by vehicle firmware, network authorization, or a manufacturer restriction. Verify support on both the vehicle side and the charger side before relying on an adapter for a road trip.
Thermal and Safety Considerations for Adapters
Adapters add a connection point, and connection points add resistance and heat. Use only adapters the manufacturer approves for your vehicle, inspect for heat or damage after sessions, and stop using any adapter that becomes unusually hot.
Battery Health, Temperature, and State of Charge: Manufacturer Guidance vs General Patterns
Battery care advice is often repeated as universal rules. It is not.
Manufacturer Guidance First: What Your EV Manual Says About Charging
Your owner’s manual is the authoritative source for daily charge targets, DC fast-charging guidance, and storage recommendations. Follow it over generic internet rules, because chemistry and thermal design differ between models.
Temperature, Thermal Management, and Cold-Weather Efficiency
Cold packs accept charge more slowly and often need heating, which raises overhead. Hot conditions trigger cooling. Both effects reduce wall-to-battery efficiency, and cold-weather losses are usually the larger of the two.
State of Charge, Charging Power, and DC Fast Charging Context
Charging is fastest and most efficient in the low-to-mid state-of-charge band. Above roughly 80%, taper slows the session and spreads fixed overhead over less energy, so the last few percent cost more per kWh than the first 50%.
Chemistry, Convenience Trade-Offs, and Long-Term Battery Expectations
LFP and nickel-based packs behave differently, and some manufacturers recommend different daily targets for each. Convenience matters too: chasing the last 2% of efficiency is rarely worth disrupting a routine that keeps the car ready.
How Charging Losses Affect Range, mi/kWh, Wh/mi, and Your Electric Bill
Charging loss sits between the meter and the dashboard, so it never appears in the car’s efficiency display.
Range and Efficiency Context: mi/kWh and Wh/mi With Charging Losses
Your vehicle reports mi/kWh or Wh/mi based on energy it delivered from the pack, not energy you bought. To estimate true cost per mile, multiply the vehicle figure by the charging-loss factor — a car showing 3.5 mi/kWh at 90% charging efficiency is really closer to 3.15 mi/kWh at the meter.
Speed, Weather, HVAC, Elevation, Payload, Tires, and Battery Temperature
Driving variables usually dwarf charging losses. Highway speed, cold or hot weather, cabin HVAC, elevation change, added payload, tire pressure and tread, and battery temperature can each move efficiency by more than the entire charging-loss percentage.
Cost Formula: Electricity Rate × kWh Delivered ÷ Efficiency + Equipment and Installation
Rates, taxes, fees, time-of-use pricing, and losses vary by utility, vehicle, and season. Verify current rates with your utility.
Time-of-Use Pricing, Charging Losses, and Real Monthly Cost Examples
Time-of-use plans can cut the rate per kWh enough to outweigh a 10–15% loss entirely. If your off-peak rate is roughly half the peak rate, shifting a 60 kWh charge into the off-peak window saves far more than the loss costs.
What to Expect in 2026: Benchmarks, Buying Checklist, and When to Call an Electrician
Use these benchmarks as sanity checks, not promises about your specific setup.
Realistic Efficiency Benchmarks by Charging Scenario
Expect roughly 75–85% on Level 1, 85–92% on Level 2 at moderate temperatures, and 90–95% at the pack on DC fast charging with additional thermal overhead in extreme weather. Cold-weather sessions can fall below the low end of these ranges.
EVSE Buying Checklist for Efficiency, Compatibility, and Support
- Confirm vehicle inlet and AC/DC compatibility
- Check the vehicle’s maximum AC charging capability
- Verify EVSE amperage and electrical requirements
- Confirm cable length, mounting, and indoor/outdoor suitability
- Verify safety listing, warranty, app requirements, and support
- Include installation, adapter, and electricity costs
Installation, Permits, and Local Code: When to Consult a Licensed Electrician
Call a licensed electrician for any new 240 V circuit, panel work, hardwiring, or troubleshooting. Mains-voltage work is safety-sensitive: do not bypass overcurrent protection, grounding, or GFCI requirements, and do not skip permits or inspection.
Evidence Limits: What This Guide Does and Does Not Claim
This article summarizes published manufacturer documentation, government and utility consumer guidance, and general owner-reported patterns. It does not report first-hand measurements, and it does not claim that any specific vehicle, EVSE, or adapter will hit these numbers.
Frequently Asked Questions
Published estimates commonly place Level 2 home charging at roughly 85–92% wall-to-battery efficiency, Level 1 at about 75–85%, and DC fast charging at roughly 90–95% at the pack before thermal-management overhead. Actual results vary by vehicle, EVSE, voltage, temperature, and state of charge.
Yes, as a percentage. Level 1 delivers only about 1.4–1.9 kW, so sessions run long and fixed overhead — standby draw, thermal management, and preconditioning — is spread across less energy. Level 2 delivers more kWh in the same window, which lowers the relative loss.
DC fast charging bypasses the onboard AC charger, so conversion losses are lower. However, high current generates heat, thermal systems work harder, and power taper above roughly 80% state of charge means the final portion of a session delivers less energy per kWh billed.
Divide the kWh you need in the battery by your charging efficiency to get kWh billed, then multiply by your electricity rate. For example, 60 kWh needed at 90% efficiency equals about 66.7 kWh billed, which at $0.16 per kWh is roughly $10.67.
Adapters add a connection point, and connection points add resistance and heat, so they can slightly increase losses. More importantly, adapters must be approved for your vehicle and for the correct AC or DC direction, since physical fit alone does not confirm protocol support.
Yes. Cold battery cells accept charge more slowly and often require heating, which consumes energy that never reaches the pack. Cold-weather sessions can fall below the low end of typical efficiency ranges, while hot conditions add cooling overhead as well.