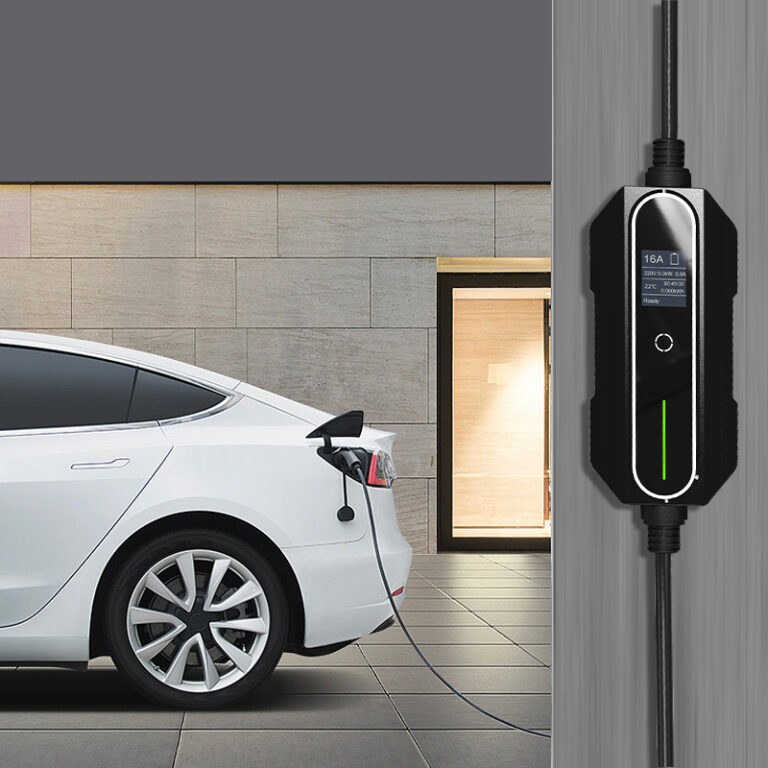
Level 2 EV Charging Efficiency: What to Expect at Home
Level 2 home charging is typically 85–95% efficient from the wall to the battery, so you pay for slightly more electricity than the pack stores. The main variables are your EVSE setting, the vehicle’s onboard charger, temperature, and how the session is managed.
EV charging efficiency Level 2 at home usually lands between 85% and 95% from the wall to the battery, which means you pay for a bit more electricity than the pack actually stores. The exact number depends on your EVSE, your vehicle’s onboard charger, wiring, temperature, and how the car manages the session.
- Efficiency: Expect roughly 85–95% wall-to-battery for a healthy Level 2 setup.
- Limits: The vehicle’s onboard AC charger often caps power below the EVSE’s rating.
- Safety: Follow manufacturer instructions and local code; use a licensed electrician for mains work.
- Cost: Model cost as rate × kWh delivered ÷ efficiency, then add taxes, fees, and.
Level 2 EV Charging Efficiency: What to Expect at Home
The Short Answer: Usually 85–95% Wall-to-Battery
Level 2 AC charging is efficient, but it is not lossless. Industry and manufacturer documentation commonly places wall-to-battery efficiency in the 85–95% range for a healthy 240 V home setup. Losses come from AC-to-DC conversion inside the vehicle, the EVSE’s own electronics, cable resistance, and thermal management that may run during or after a session.
That range is a general pattern, not a guaranteed spec. A short, cold, or low-power session can sit at the lower end. A warm, steady, mid-power session with a well-matched EVSE often sits near the top. Treat 85–95% as a planning assumption, then refine it with your own utility data and vehicle readouts.
Why 100% Is Not Realistic and What That Means for Your Bill
Every conversion step loses some energy as heat. The EVSE turns grid AC into conditioned AC, the onboard charger rectifies it to DC, and the battery accepts it with its own internal resistance. Add standby draw, cable losses, and possible post-charge thermal management, and a perfect 100% is physically out of reach.
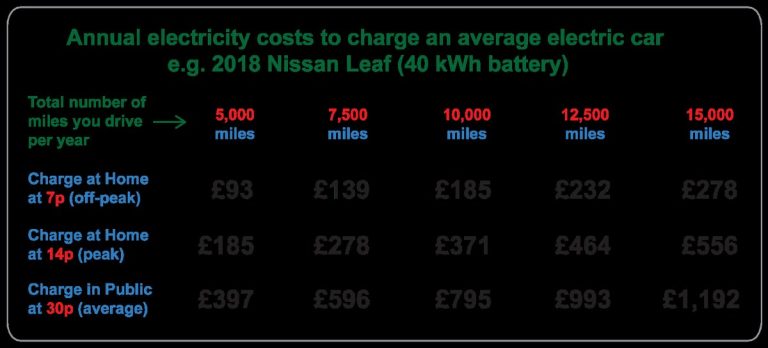
Practically, if you add 40 kWh to the pack at 90% efficiency, the meter sees roughly 44.4 kWh. At $0.15/kWh, that is about $6.66 instead of $6.00 — a modest but real difference. The gap widens with higher rates, colder weather, or lower-efficiency sessions.
Charger Hardware: What Actually Affects Level 2 Efficiency
Connector Type, Vehicle Onboard-Charger Limit, and EVSE Amperage/kW
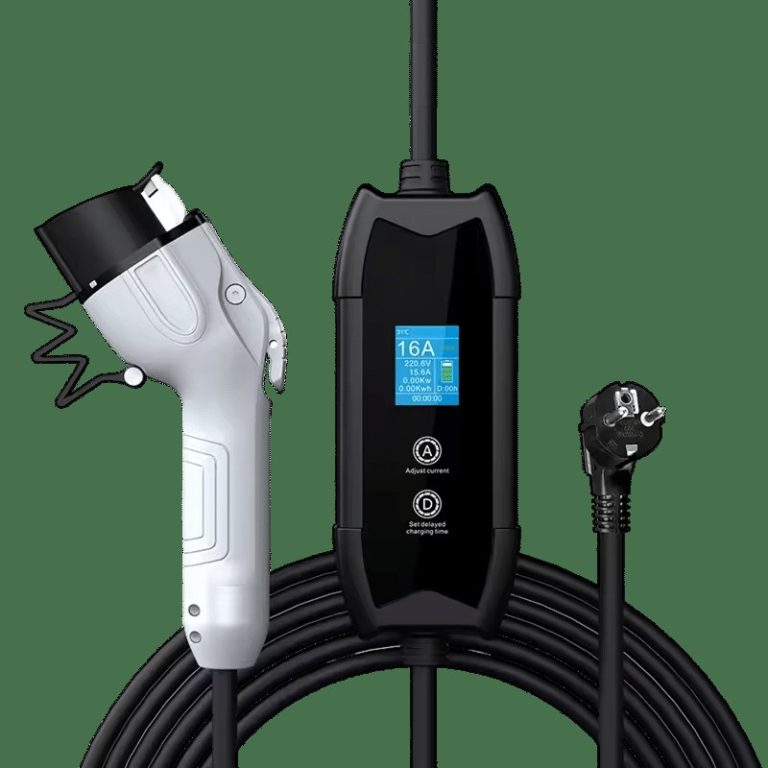
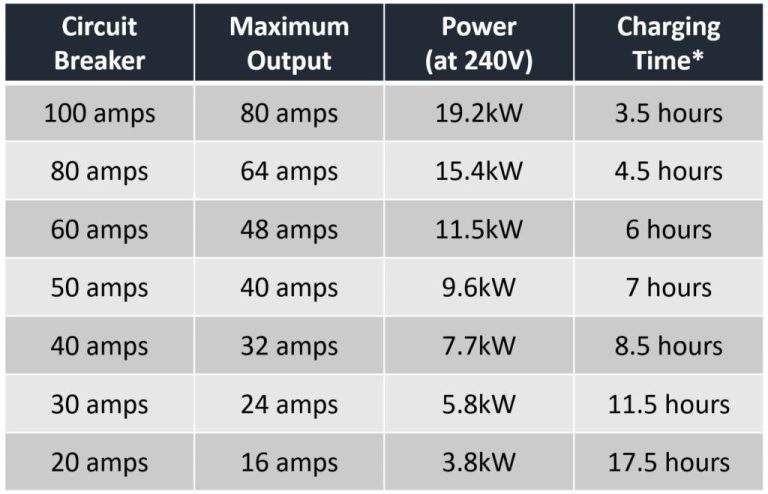
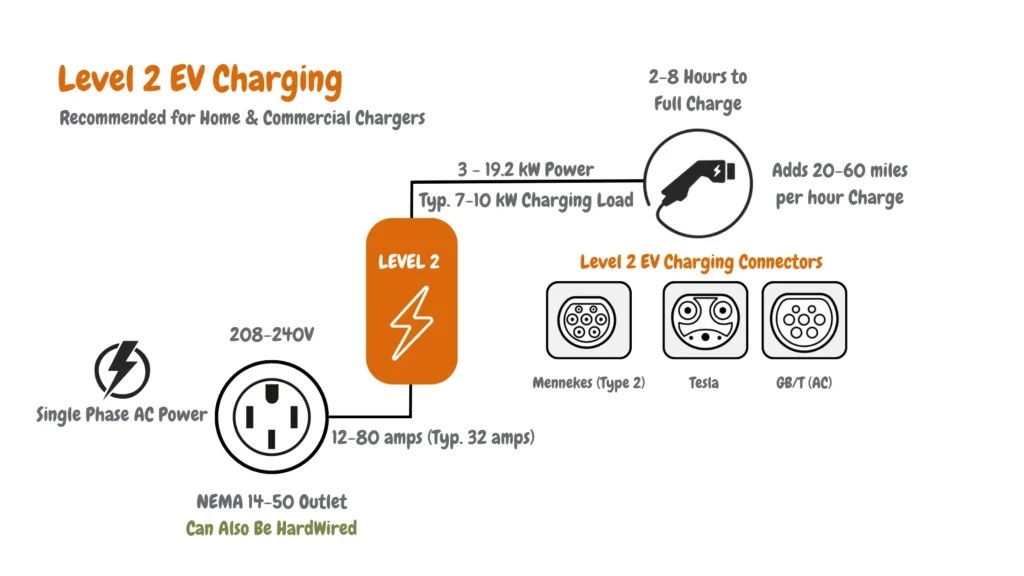
The EVSE sets a ceiling, but the vehicle’s onboard AC charger usually sets the real one. A 48 A EVSE on a 60 A circuit can deliver up to about 11.5 kW, yet many EVs cap AC input at 7.2 kW, 9.6 kW, or 11 kW. If the car’s limit is lower than the EVSE’s, the extra capacity simply goes unused.
Connector type — J1772 or NACS / SAE J3400 — does not by itself change efficiency much at the same amperage. What matters is that the inlet, cable, and EVSE are rated for the current you intend to run. If you are weighing amperage options, our guide on whether 40 amps is enough for a Level 2 EV charger walks through the trade-offs.
For a deeper look at how amperage converts to kilowatts, see how many kW a 48 amp Level 2 EV charger delivers.
Plug-In vs Hardwired, Circuit/Panel Implications, and Cable Length
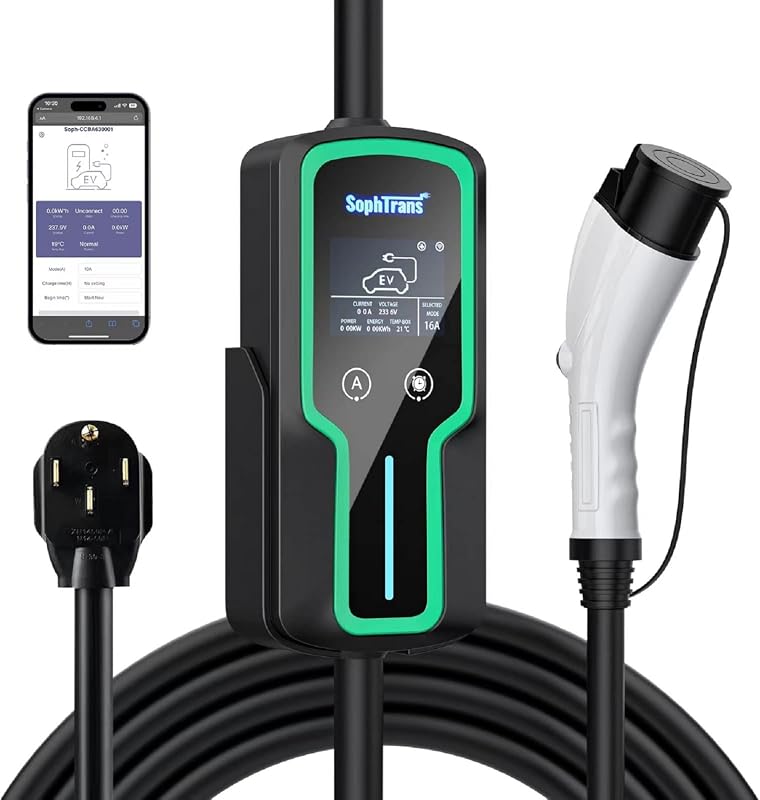
Hardwired installs avoid the plug-and-receptacle interface, which removes one potential heat and resistance point and often allows the highest continuous current. Plug-in units are convenient but typically capped by the receptacle and plug rating, and they add a small amount of contact resistance.
Longer cables and undersized conductors increase voltage drop, which nudges efficiency down. Following the manufacturer’s wire and breaker instructions matters more than chasing a fraction of a percent.
Weather Suitability, Smart Features, Warranty, and Support
Cold weather can reduce usable charging efficiency because the pack may need warming, and some EVs limit acceptance until the battery is in a favorable temperature window. Hot weather can trigger cooling during or after a session. Smart features such as scheduled charging, load management, and TOU scheduling change when you charge, and indirectly how much you pay — not the physical conversion efficiency.
Verify enclosure ratings, operating temperature limits, safety listing, warranty terms, and app/cloud dependency from the manufacturer’s documentation before buying.
Plug-In vs Hardwired Level 2: Side-by-Side Efficiency and Fit
Same Criteria Comparison: Amperage, Losses, Installation, Portability, Code
Uses a compatible receptacle and plug. Portable between locations, generally lower maximum continuous current, and adds a small contact-resistance loss. Local code and receptacle type matter.
Directly wired to a dedicated circuit. Typically supports the highest current the EVSE allows, avoids plug wear, and is usually the choice for permanent home installs. Requires a qualified electrician.
Who Each Option Fits in 2026
Plug-in suits renters, frequent movers, or households that want to take the unit on trips. Hardwired suits owners who want maximum current, a clean permanent install, and fewer connection points to maintain. Both can deliver 85–95% wall-to-battery efficiency when installed and used correctly — the difference is usually a fraction of a percent, not a step change.
Adapters and Compatibility: Level 2 Efficiency Across Connectors
AC Level 2 Adapters: J1772, NACS, Source, Destination, and Direction
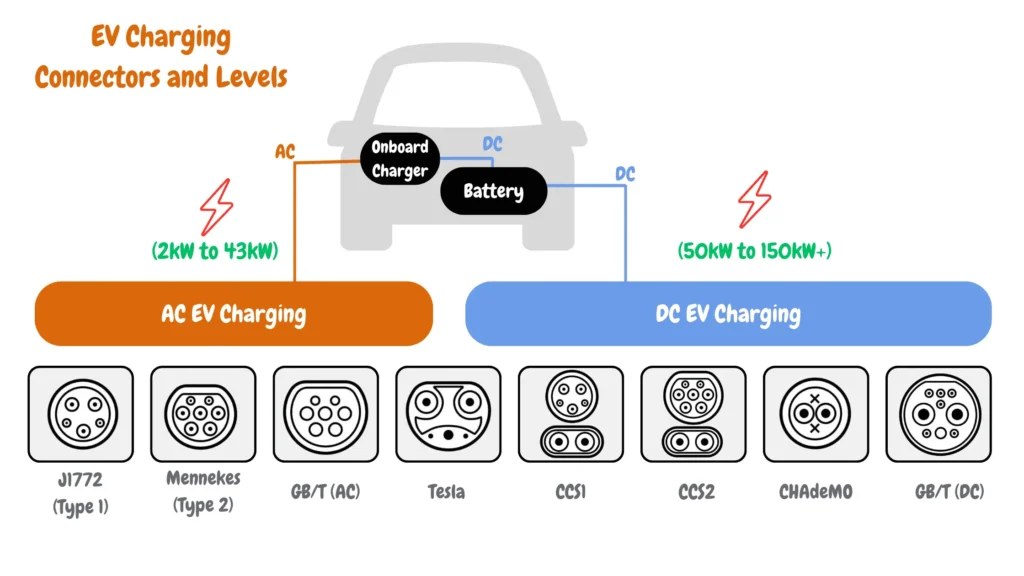
Level 2 adapters are AC-only. A J1772-to-NACS or NACS-to-J1772 adapter changes the physical interface, not the charging mode. Direction matters: the adapter must match the vehicle inlet on one side and the EVSE connector on the other, and it must be rated for the current and voltage of the session.
Power Limits, Thermal/Safety Considerations, and Firmware/Vendor Requirements
Adapters introduce an extra connection and heat path. Use only adapters rated for the current you plan to draw, and follow the manufacturer’s temperature and inspection guidance. Some vendors require specific firmware or vehicle software for full compatibility, and some networks restrict third-party adapters.
Vehicle and Network Restrictions That Can Reduce Efficiency
A vehicle may derate AC charging when the inlet or adapter gets warm, when the pack is cold, or when an unfamiliar adapter handshake is used. A network may limit session power to a set amperage. None of these are efficiency losses in the physics sense — they are power limits that stretch session time and can change the effective wall-to-battery ratio.
Charging Cost and Efficiency Math: Assumptions You Can Reuse
Formula: Cost = Electricity Rate × kWh Delivered ÷ Charging Efficiency
Start with the energy you actually need in the pack. Divide by your efficiency assumption to get the energy the meter sees. Multiply by your all-in rate, including taxes, fees, and any demand or TOU structure.
Example only. Rates, taxes, TOU windows, and losses vary by utility, season, and vehicle.
Time-of-Use Pricing, kWh Delivered, and Charging Losses
TOU plans can cut the effective rate dramatically when you charge overnight, but losses still apply to whatever you draw during that window. Check whether your utility applies a separate meter, EV rate, or demand charge. Verify current rates on your utility’s own page before relying on any published figure.
Equipment and Installation Costs to Add to the Equation
The EVSE, permit, electrician labor, possible panel work, and any adapter or mounting hardware add to the total cost of ownership. Efficiency gains between two similar units are usually too small to justify a purchase on their own — installation fit, safety listing, warranty, and support matter more.
Battery Health and Level 2 Efficiency: What Manufacturers Say vs. General Patterns
Temperature, State of Charge, and Charging Power
Manufacturers publish their own guidance for charging habits, temperature windows, and daily state-of-charge targets. Those recommendations vary by chemistry, pack design, and thermal management. There is no universal 80% rule that applies to every EV.
DC Fast Charging Context, Chemistry, and Thermal Management
DC fast charging bypasses the onboard AC charger and pushes current directly into the pack, which is why it can be faster but also harder on cells when repeated in extreme temperatures. Level 2 sits in a moderate range that most manufacturers treat as the everyday default.
Convenience Trade-Offs: Slower Level 2 vs. Faster DC
Level 2 wins on overnight convenience, lower equipment cost, and gentler thermal load. DC wins on time when you are away from home. Efficiency differences between the two are real but usually secondary to how you actually use the car.
From Wall to Wheels: Range Efficiency and Level 2 Charging Losses
mi/kWh and Wh/mi: The Metrics That Matter
Vehicle efficiency is usually quoted as mi/kWh or Wh/mi. Higher mi/kWh means the car goes farther per unit of stored energy. Charging losses sit on top of that: the wall delivers more energy than the pack stores, so your effective cost per mile is higher than the vehicle’s rated efficiency alone suggests.
Speed, Weather, HVAC, Elevation, Payload, Tires, and Battery Temperature
Highway speed, cold temperatures, cabin heating, headwinds, elevation gain, extra weight, underinflated or high-rolling-resistance tires, and a cold pack all reduce mi/kWh. These are driving-side losses, separate from charging losses, but they stack in your real cost per mile.
How Charging Losses Change Your Effective Wh/mi
If the car reports 280 Wh/mi but charging is 90% efficient, the wall effectively supplies about 311 Wh/mi. That is the number to use when comparing EV fueling cost to gasoline or to a different charging setup.
Installation, Code, and Panel Realities for Efficient Level 2
Product Manual and Local Code/Permit Rules Come First
The manufacturer’s installation manual and your local authority having jurisdiction govern the circuit, breaker, conductor, grounding, and receptacle or hardwire requirements. Do not assume a universal US rule applies to your home.
Panel Load Calculations, Service Upgrades, and Licensed Electricians
A load calculation determines whether your existing service and panel can support the new circuit. If not, a service upgrade may be needed. A licensed electrician can perform the calculation and pull permits. If you are sizing a circuit for a specific charger, our guide on 48 amp EV charger breaker size explains how the continuous-load rule works in practice.
For a related question, see whether a 48 amp EV charger needs a 60 amp circuit.
No Universal Breaker/Wire Requirement: Why Assumptions Fail
Breaker size, conductor gauge, receptacle type, and GFCI requirements depend on the equipment instructions, the continuous-load rating, the run length, and local code. Copying a neighbor’s setup is not a safe shortcut.
Evaluating Level 2 Charger Efficiency Claims: Evidence Limits at EmissionsFreeCars
Mark Reynolds’ 2026 Evidence Standard: What We Can and Cannot Verify
EmissionsFreeCars evaluates Level 2 chargers using manufacturer documentation, safety-listing records, published specifications, and clearly labeled owner-reported patterns. We do not claim first-hand installation, measurement, or long-term ownership testing unless verified evidence is supplied.
How to Read Manufacturer Specs, Reviews, and Real-World Reports
Manufacturer specs describe rated conditions, not your garage. Reviews and owner reports can reveal patterns — heat, app behavior, derating — but they are anecdotal. The most reliable efficiency estimate comes from comparing your utility meter or submeter reading to the kWh your vehicle reports adding over the same session.
Browse our Level 2 home chargers coverage for related buying and installation context.
Bottom Line
Plan on 85–95% wall-to-battery efficiency for a well-installed Level 2 setup, and treat anything outside that band as a signal to check temperature, amperage, wiring, or vehicle behavior. The biggest cost levers are your electricity rate and your driving efficiency — charging losses are real but rarely the deciding factor.
Frequently Asked Questions
Most documented Level 2 setups land between 85% and 95% wall-to-battery. The exact figure depends on the EVSE, the vehicle’s onboard charger, wiring voltage drop, ambient temperature, and whether the pack needs thermal conditioning during the session.
Not automatically. Higher current can reduce session time and, in some cases, keep the vehicle in a more favorable operating window, but the onboard charger’s conversion losses dominate. If your vehicle caps AC input below the EVSE’s maximum, the extra capacity is simply unused.
At the same voltage and current, the connector type does not meaningfully change conversion efficiency. What matters is that the connector, cable, and inlet are rated for the current and that any adapter is properly rated and installed.
Compare the kWh your utility meter or submeter reports for a charging session against the kWh your vehicle says it added. Divide the vehicle figure by the meter figure. Repeat across a few sessions and average the results.
Yes, in many vehicles. Cold packs may accept less power and may require warming, which draws energy that does not go into range. Hot conditions can also trigger cooling during or after charging. Both effects vary by model and thermal-management design.
Manufacturers generally treat Level 2 as the everyday default because it is slower and gentler on cells. DC fast charging has its place for trips, but repeated high-power sessions in extreme temperatures can stress a pack more. Follow your vehicle manufacturer’s specific guidance.